Analyze performance
Creatives are assigned a respective Creative ID# and campaigns a Campaign ID#.
Advertiser statistics
A detailed view of the most important statistics for your campaigns.
Report Builder
The Report Builder provides a customizable view of your campaigns' statistics.
Advertiser statistics - Report Builder preview
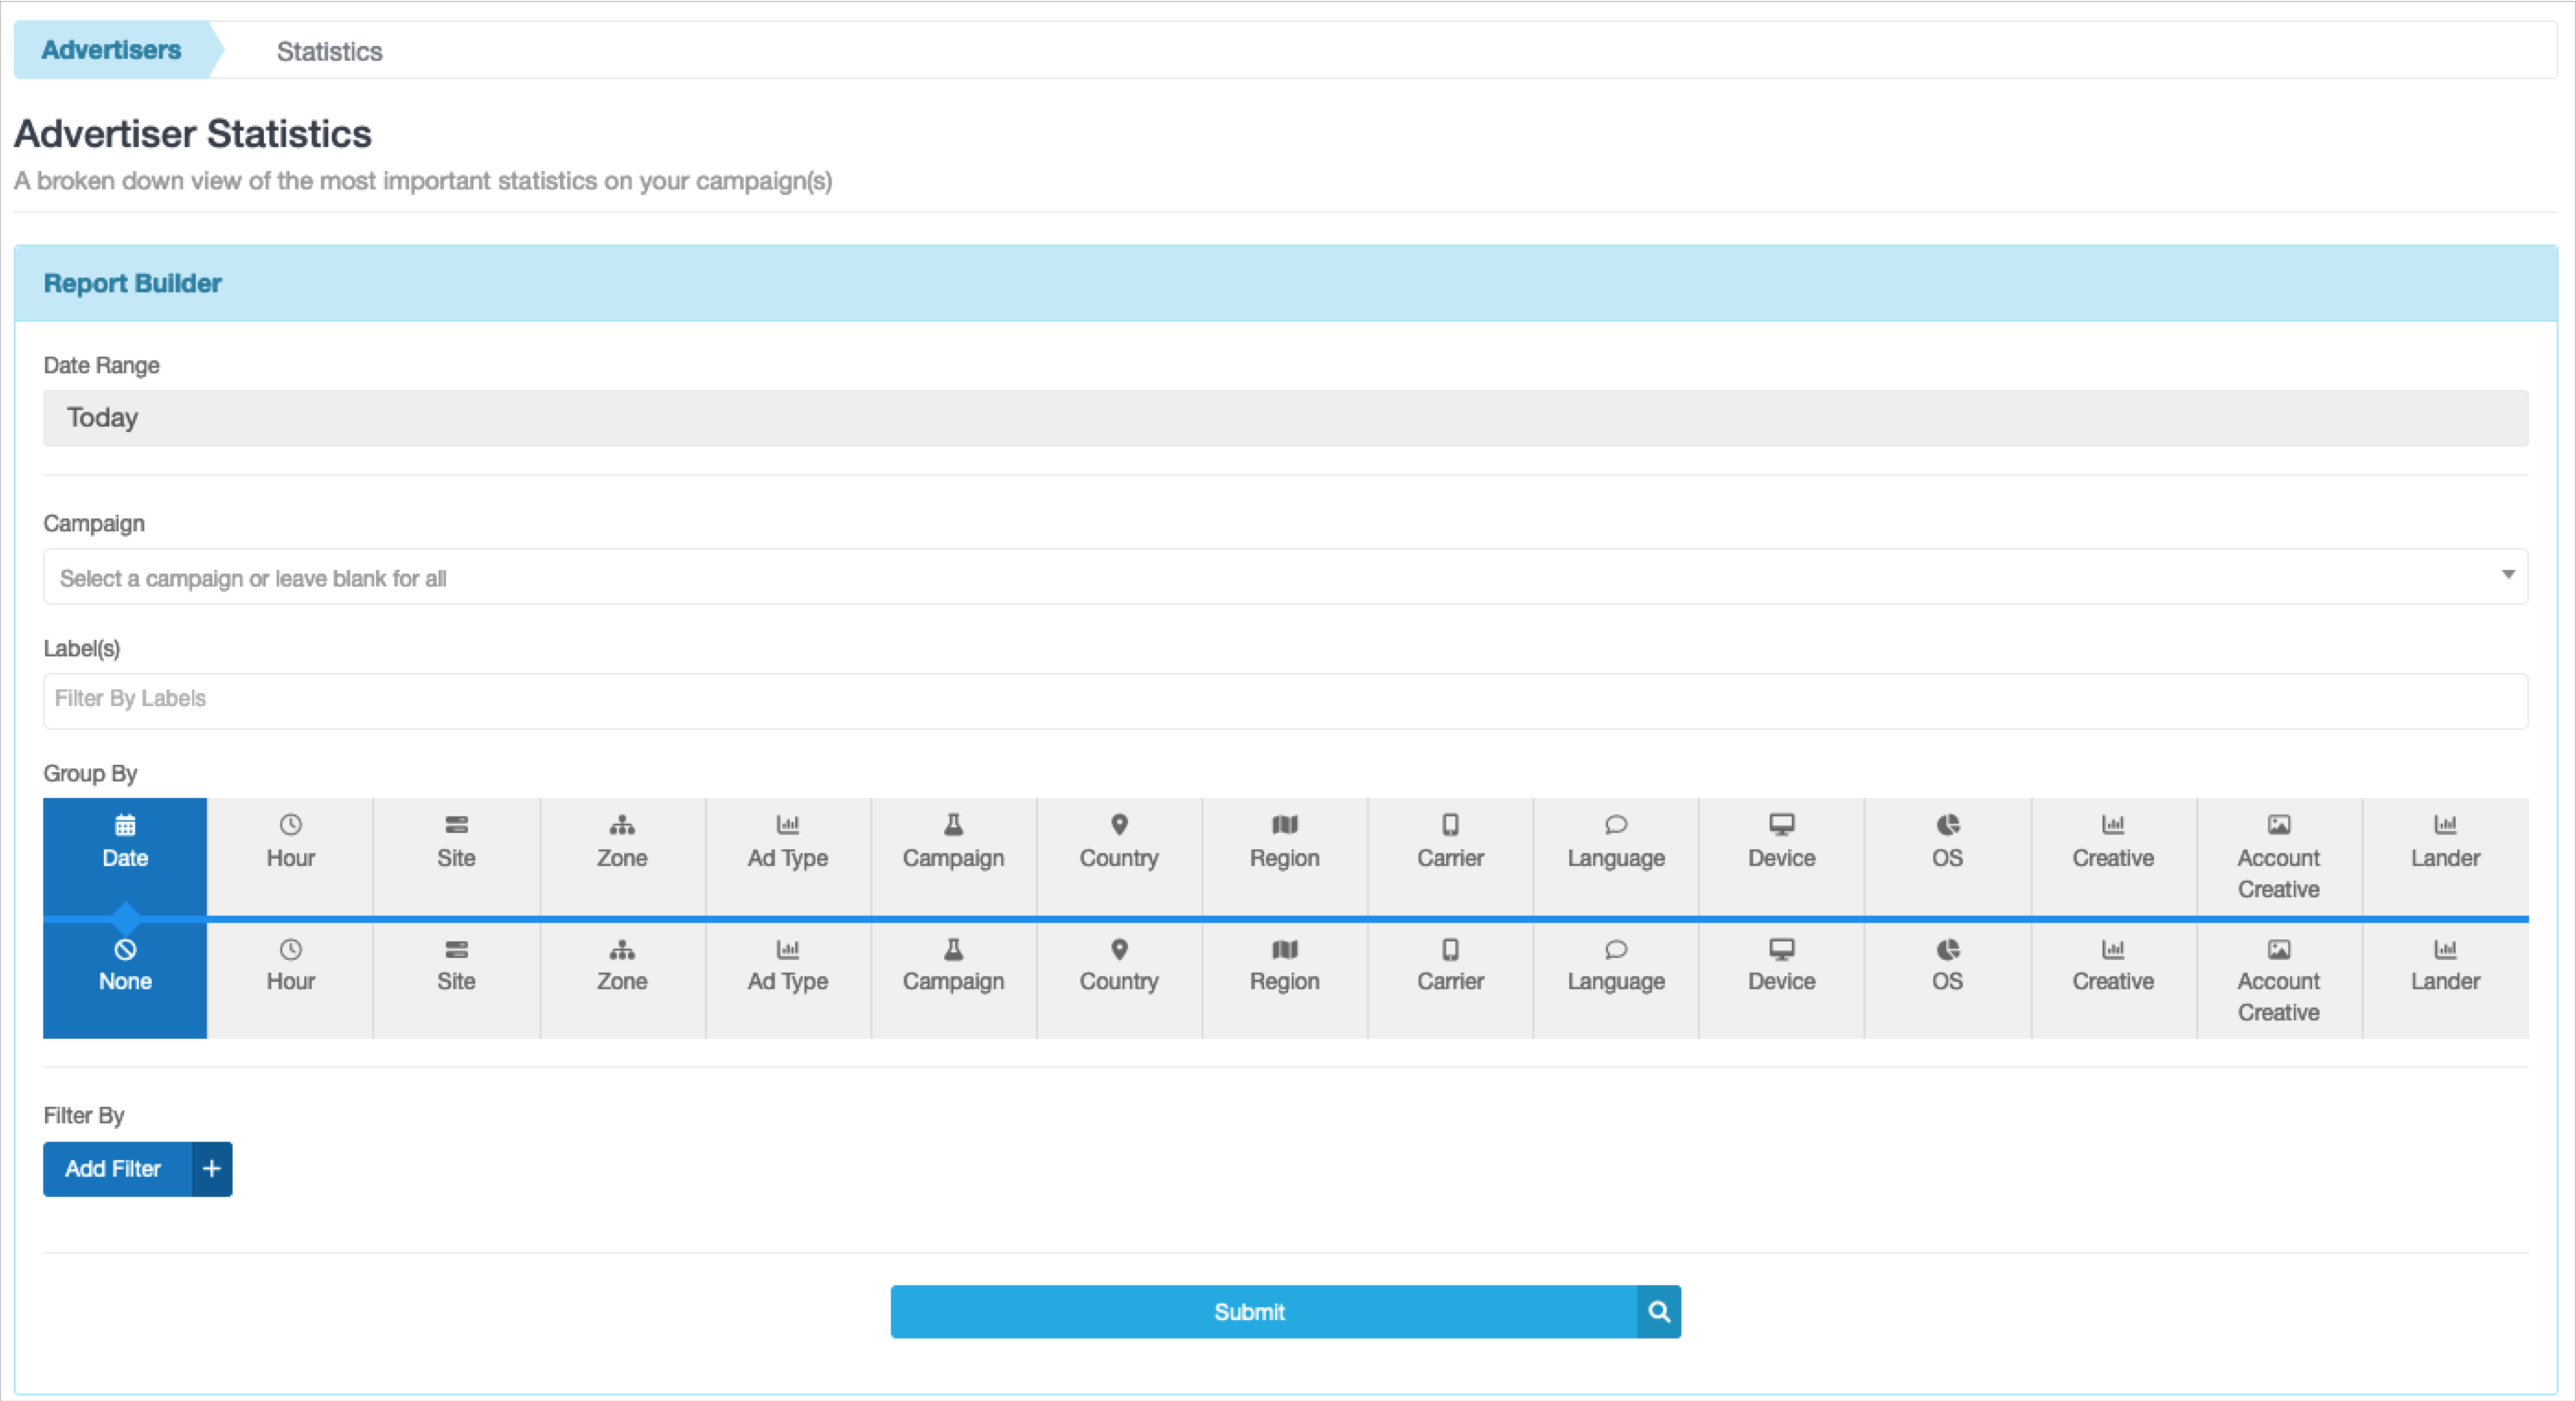
Go to Advertisers in the main menu and select Statistics from the dropdown.
Alternatively, from your dashboard, select the blue Advanced Statistics box above the overview graph.
Building the report
In the Report Builder, select the following:
- Date Range*: The period you wish to analyze.
- Campaign: The campaign you want to view, searchable by name or ID.
- Label(s): Filters for specific labels.
- Group By*: The first row is required, determining what information is displayed in the graph and how data is grouped in the chart.
- Add Filter: Additional filtering options by IS or IS NOT.
- Submit*: Build the report by selecting this box.
* indicates a required field.
Note that you'll need to select at least one filter before you can save the report.
Build a report example
- Date Range: Last 7 Days
- Group by: Creative and Date to identify which dates a creative performed best.
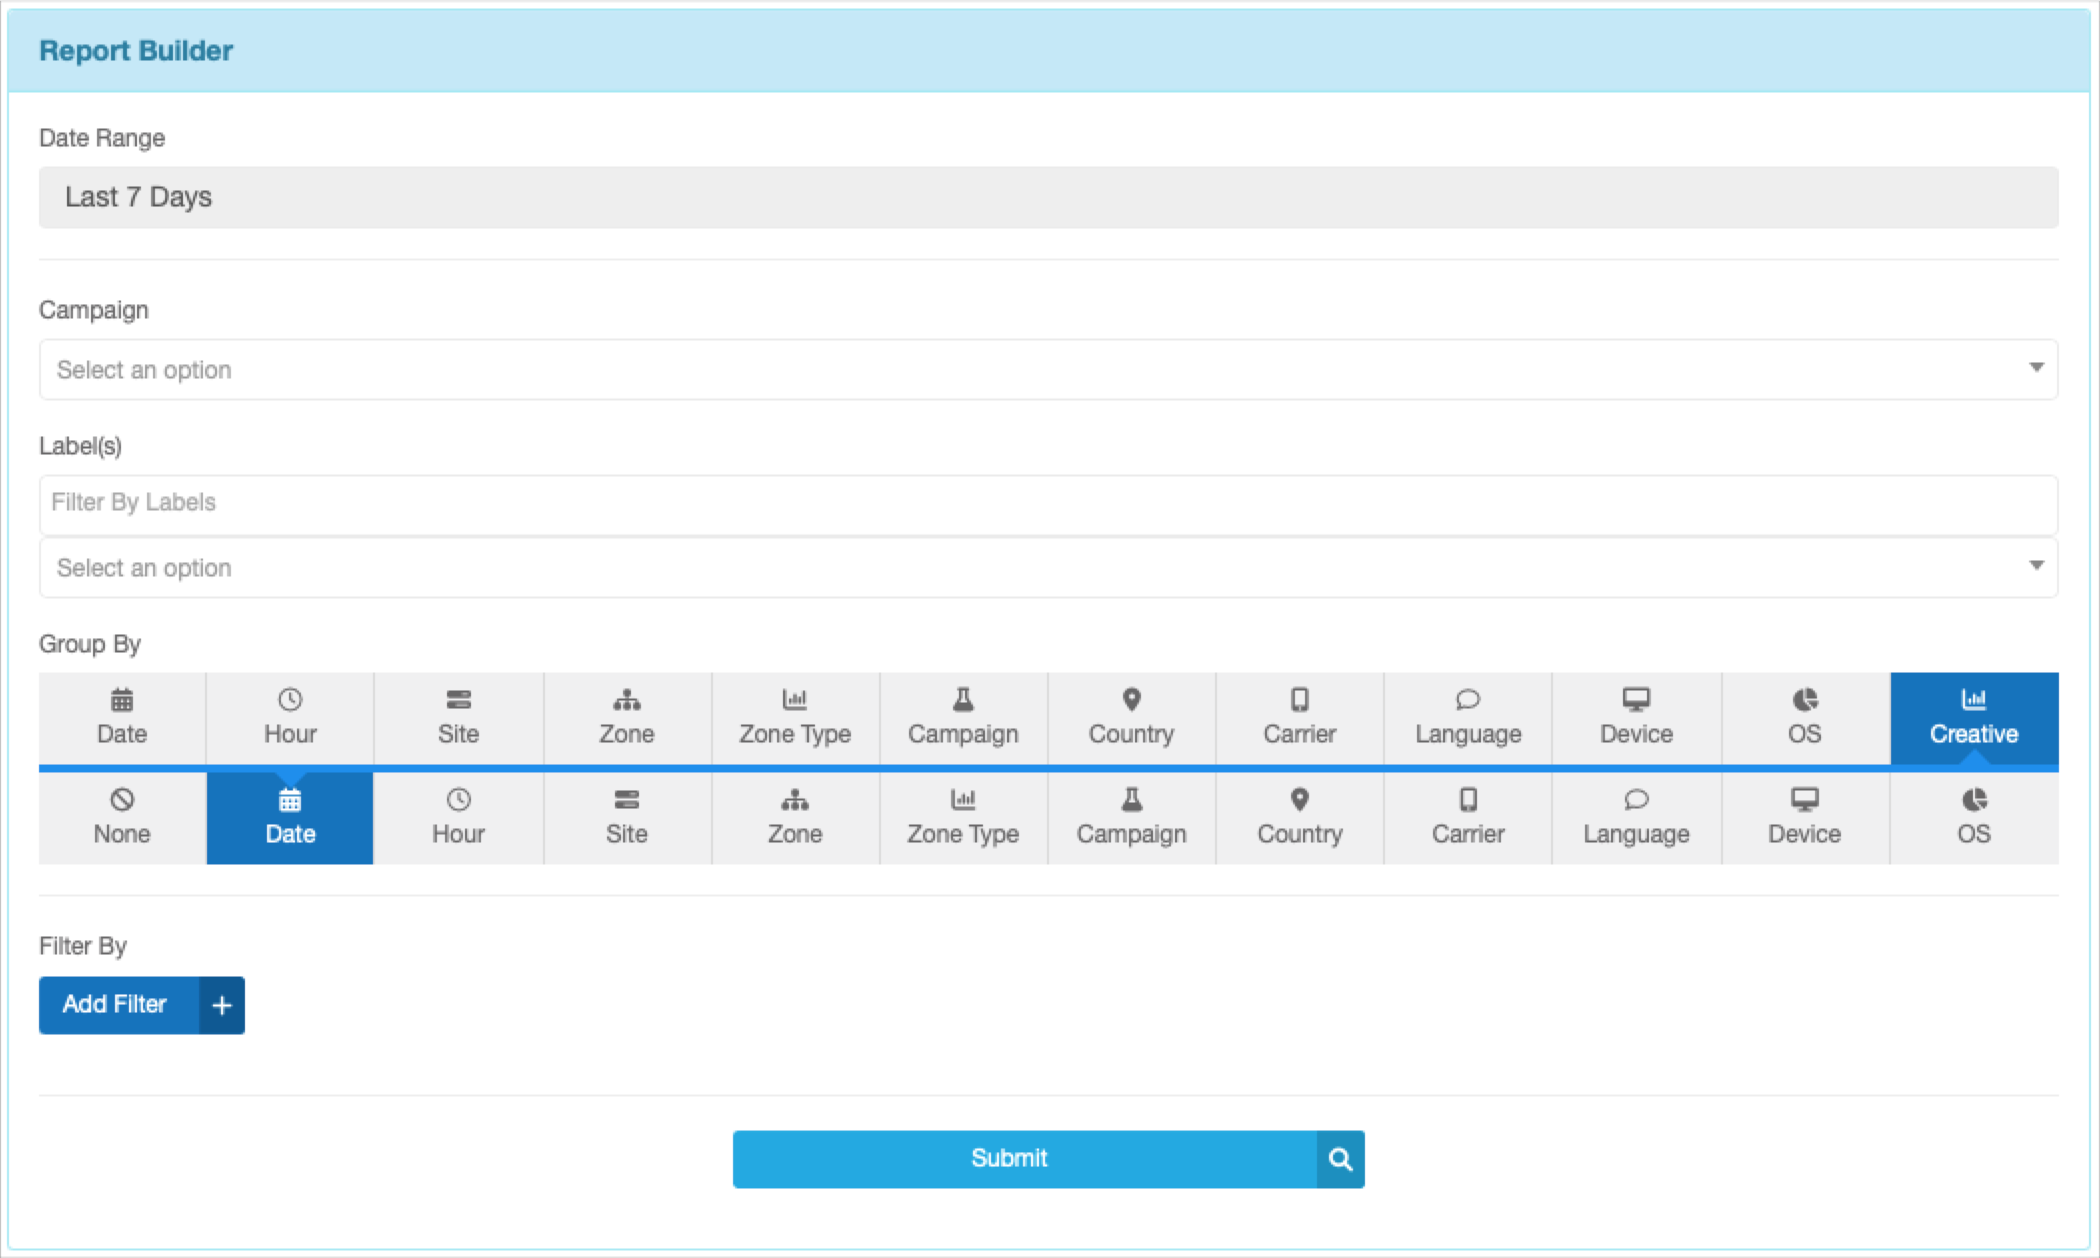
The graph displays impressions per creative within the date range.
The chart below is organized by Creative for each Date within the selected period. Each row shows a creative’s ID for that date.
A creative appears in several rows of the chart because there is data from several dates.
Editing the graph
Adjust the Y and X axis of the graph:
- Underneath the Report Builder and above the graph are the Displaying options.
- Use the dropdown menu to select a new variable, and the graph will automatically update.
Example: If Spend and Date are selected, the graph will display daily spending for the ad campaign.
Campaign statistics
A detailed view of your campaign-specific statistics.
Report Builder
The Campaign statistics Report Builder focuses on individual campaigns.
Campaign statistics - Report Builder preview
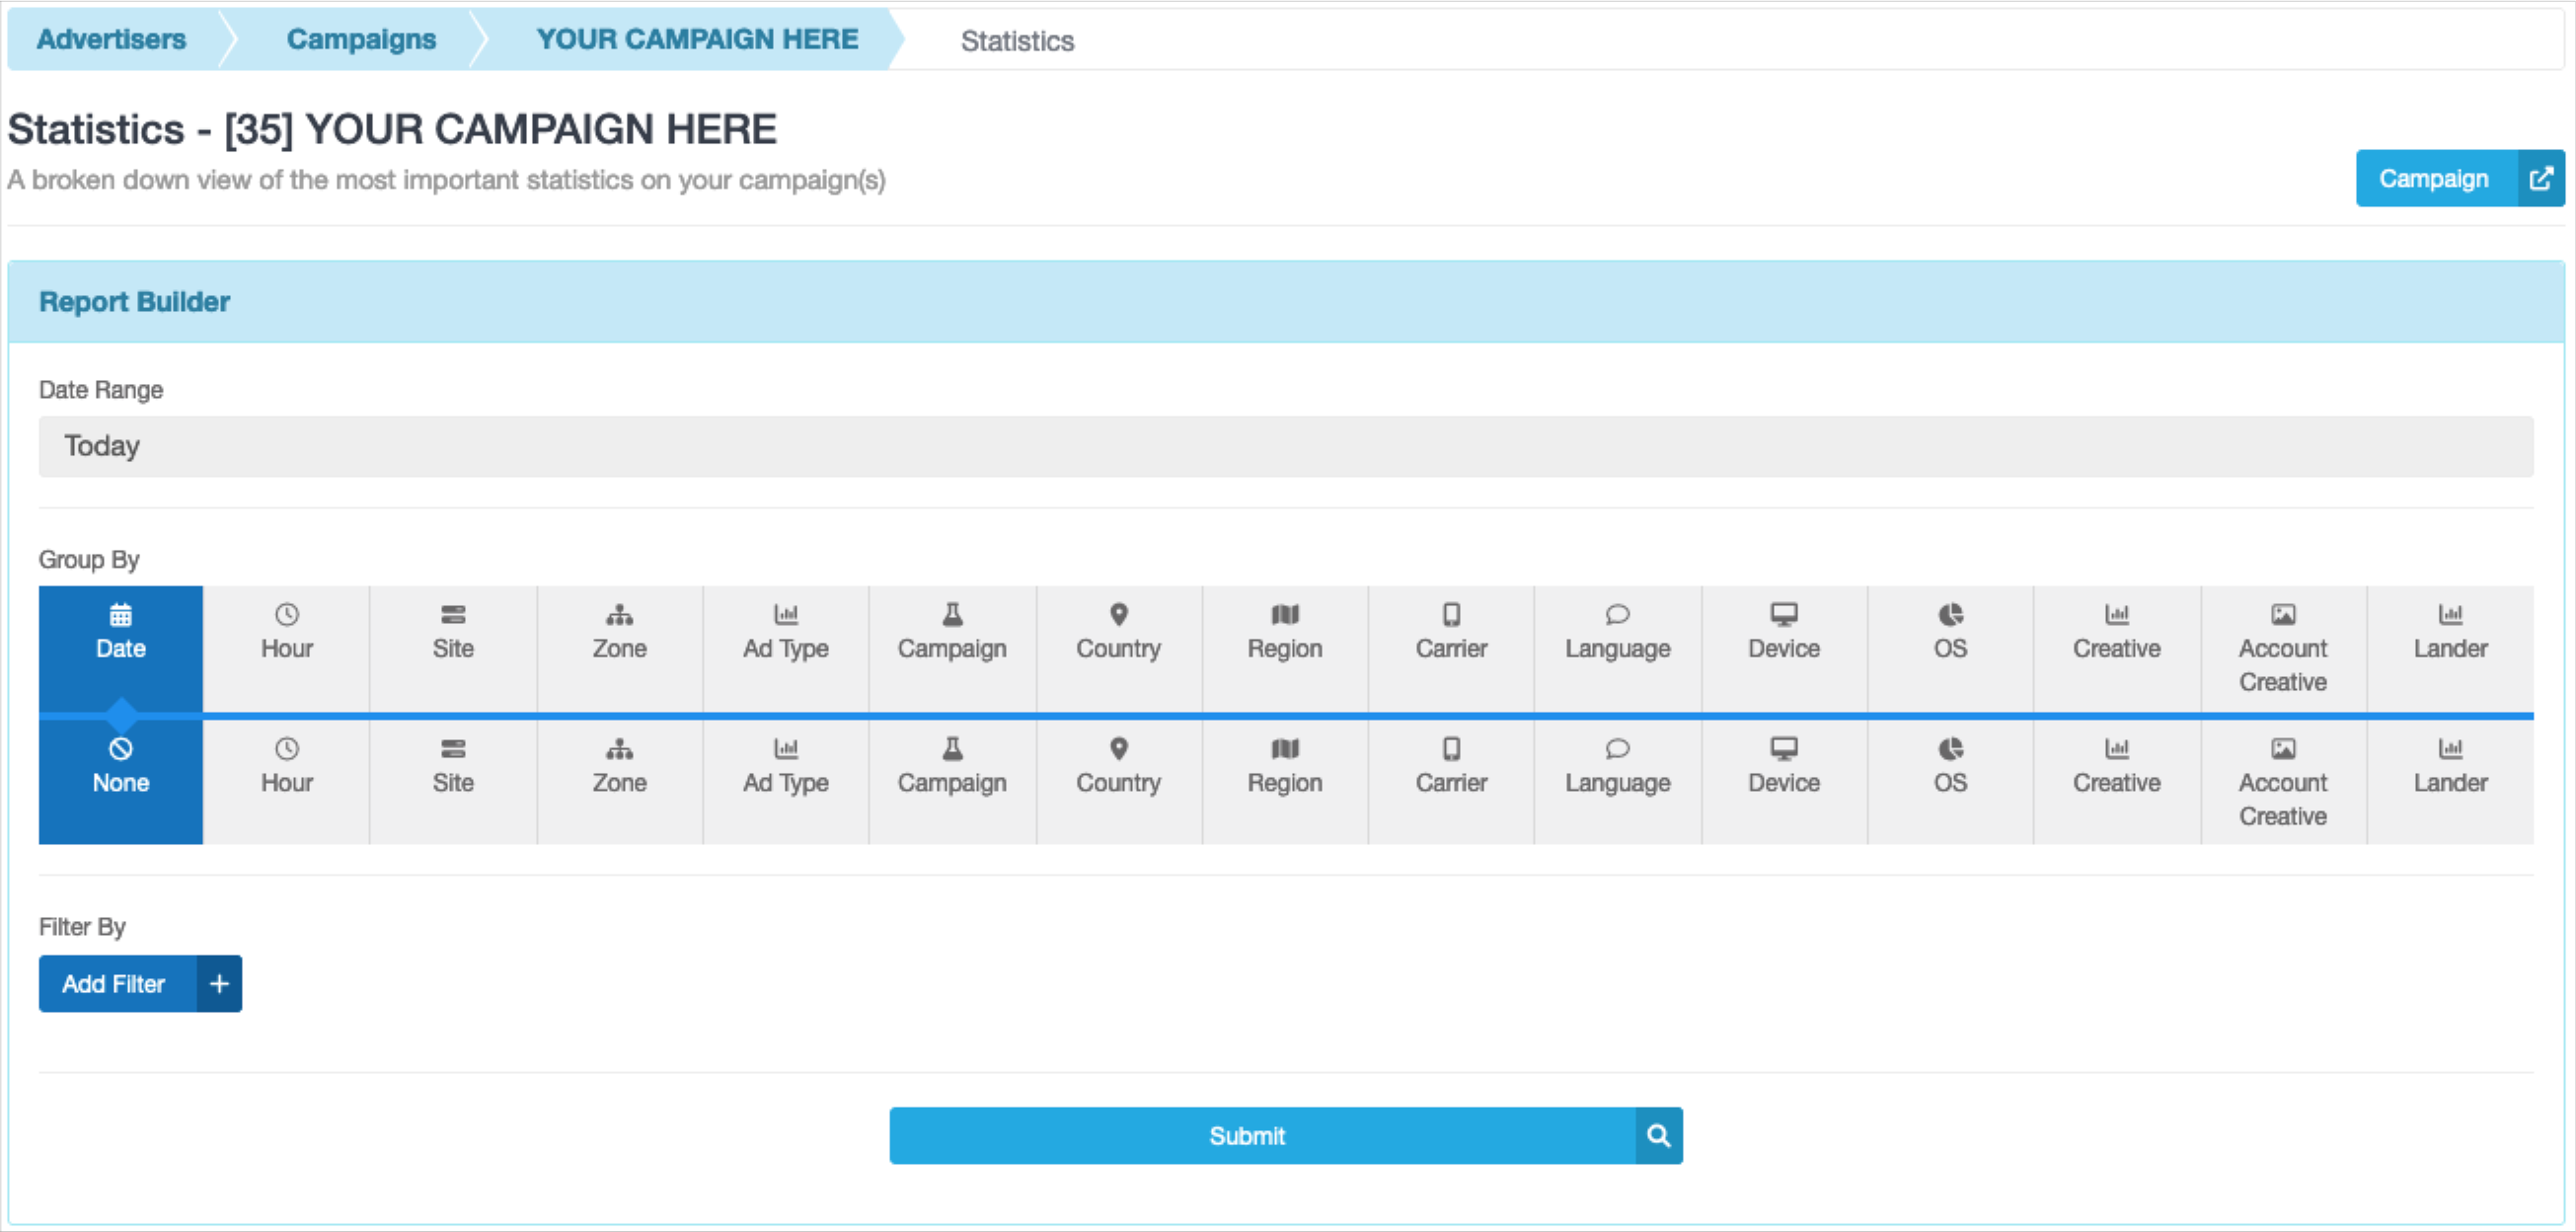
The Report Builder for Campaign statistics is similar to the Advertiser statistics' but offers fewer customization options.
If you group by Creative only, you can Pause creatives by unselecting their checkboxes.
Go to Advertisers in the main menu and select Campaigns from the dropdown.
View an ad campaign’s statistics by selecting the Statistics icon next to its name or by accessing the dropdown menu in Actions ✱ and selecting View Stats.
Alternatively, select the Name of the campaign on the campaigns page to access the Campaign Overview. From there, you can select Statistics from the left menu or the blue More stats box above the weekly overview.
The displayed Report Builder is specific to the selected ad campaign, as indicated by the title: Statistics - [ID#] YOUR CAMPAIGN HERE.
Alternatively, access the Advertiser statistics Report Builder and filter by a specific campaign.
Build the report
In the Report Builder, select the following:
- Date Range*: The period you wish to analyze.
- Group By*: The first row is required, determining what information is displayed in the graph and how data is grouped in the chart.
- Add Filter: Additional filtering options by IS or IS NOT.
- Submit*: Build the report by selecting this box.
Example: If Today for Date Range and Hour for Group By are selected for an active campaign (None for the second row), the report will display hourly impressions for the campaign.
Edit the graph
Adjust the Y and X axis of the graph:
- Underneath the Report Builder and above the graph are the Displaying options.
- Use the dropdown menu to select a new variable, and the graph will automatically update.
Creative statistics
View performance metrics for all creatives, selected campaigns, or individual creatives.
From the Creatives Library
Access all creatives in the Creatives Library.
Go to Advertisers in the main menu and select Creatives from the dropdown.
In the Creatives Library, double-click a creative to view its Creative ID#, Ad Type, and Status, along with current Impressions, Clicks, and CTR.
By building a report
Alternatively, access either the Advertiser stats or Campaign stats Report Builder to create a report for all creatives, selected campaigns, or individual creatives.
Example 1: Selecting Yesterday for Date Range and Creative for Group By in the Advertiser stats Report Builder will show impressions per creative for the previous day.
Example 2: Selecting Today for Date Range, Creative for Group By, and Campaign Is for Add Filter with YourCampaign will display today’s impressions per creative for the specified campaign.
Spend overview
The graph on your Dashboard shows daily spending for the last 14 days.
Go to Advertisers in the main menu and select Dashboard from the dropdown.
You can access Advertiser statistics by selecting the blue Advanced Statistics box above the graph.
Hover over a bar in the graph to display detailed information for that date.